Weather and Waves data
The weather data is provided by UK Met Office.
The Wave / Swell height, direction and period data is provided by Open-Meteo.
Visibility
Visibility measures the distance at which an object can be clearly seen.
- VP (Very Poor) Less than 1 km
- P (Poor) 1.1 km to 4 km
- M (Moderate) 4.1 km to 10 km
- G (Good) 10.1 km to 20 km
- VG (Very Good) 20.1 km to 40 km
- E (Excellent) Greater than 40 km
UV
UV exposure index and the protection required to help keep you safe:
0 No risk of UV – It’s safe to stay outside.
1-2 Low – You can safely stay out side. Consider sunscreen in direct sunlight.
3-5 Moderate – Take care during midday hours and do not spend too much time in the sun unprotected. Sunscreen advised.
6-7 High – Seek shade during midday hours, cover up and wear sunscreen.
8-10 Very high – Spend time in the shade between 11am and 3pm. Shirt, sunscreen and hat are essential.
11 Extreme – Avoid being outside during midday hours. Shirt, sunscreen and hat essential.
Beaufort Wind Scale
Barometric pressure
Force -Wind – Wave – Description
mph meters
0 0-1 0 Calm-Sea like a mirror.
1 1-3 <0.3 Light Air-Ripples.
2 4-7 <0.6 Light Breeze-Small wavelets.
3 8-12 <1.2 Gentle Breeze-Large wavelets.
4 13-18 <2 Moderate Breeze-Small waves.
5 19-24 <3 Fresh Breeze-Moderate waves.
6 25-31 <4 Strong Breeze-Large waves.
7 32-38 <5.5 Near Gale-Large waves.
8 39-46 <7.5 Gale-Moderately High waves.
9 47-54 <10 Severe Gale-High waves.
10 55-63 <12.5 Storm-Very high waves.
11 64-72 <16 Violent Storm-Exceptionally high waves.
12 72-83 >14 Hurricane-Extreme waves.
The standard barometric pressure at sea level is 1013 millibars and a normal range is between 965 and 1040.
High pressure typically indicates good weather, clear skies with the sun warming us and the earths surface.
Low pressure means colder weather, clouds blocking the sun, rain and wind. Very low pressure over open water creates heavy winds which can turn into hurricanes or typhoons.
Lower barometer means higher sea levels and higher values lower sea levels, roughly 1 millibar is equivalent to 1cm change in the sea level hieght.
Typically this is + / – 30cm, but with extreme pressure / weather changes this can be 60cm or more.
Wave data
Height of waves
For a more information see the following links
Met Office – What does this forecast mean
Met Office – Understanding beach forecasts
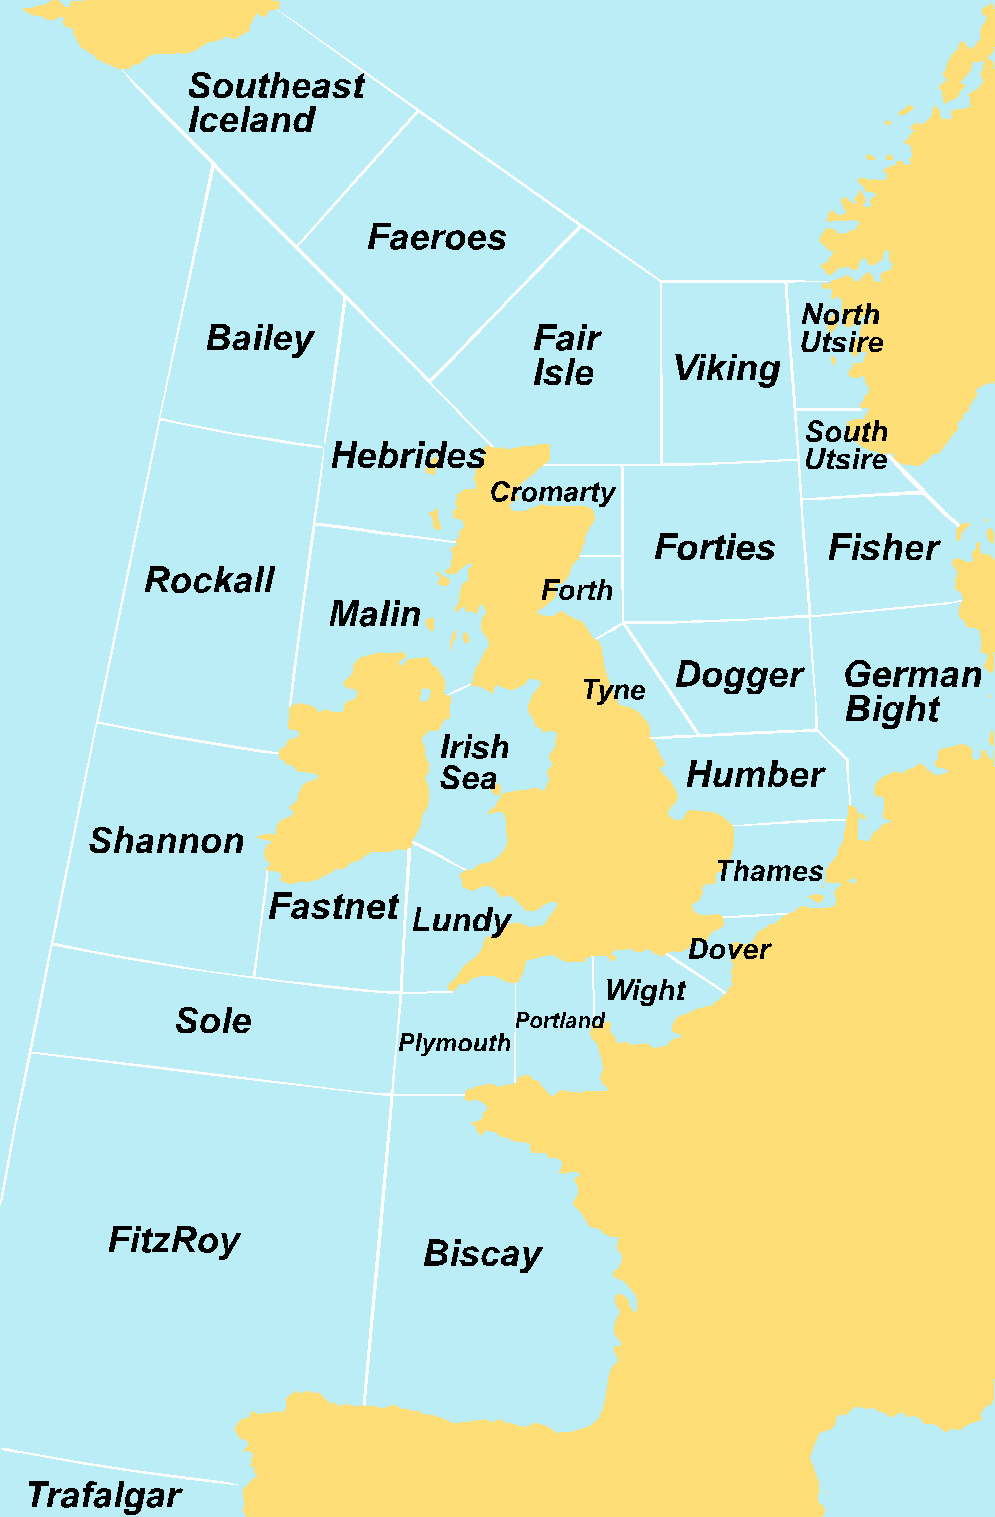
How to read a shipping forecast
Thewaveshack – How to read a surf report